Basic Usage
Bluebook, the testing software you’ll be using, has a built-in graphics calculator called desmos. This graphics calculator is extremely powerful and pleasant to use, so this should be your go-to for any question involving graphing or extensive algebra.
This section demonstrates the most important features of the desmos app. This tool can make a huge difference to your score, no matter your current math level, so make sure you learn the content on this page thoroughly.
Main Ideas
Unlike on your physical graphics calculator, desmos is highly flexible when it comes to inputting functions and equations into their graphics calculator. All these equations will work just fine:
Desmos will treat and as variables and normal letters like and as constants, mostly. HOWEVER this is not always the case, so it's crucial that you take some time to understand how Desmos interprets equations with different letters.
🚫 The bluebook version of desmos doesn’t allow you to copy paste, so getting fast at typing math is a must!
By default, desmos interprets values passed into trig functions as radians.
If you close desmos on bluebook, the mode will remain the same as what it was when you closed it.
Learn the most important shortcut keys to speed things up 🔥
The app
Here’s an embedded example of desmos. Feel free to fiddle with the demo below:
Try it yourself 👇
Plotting basic functions & equations
Acceptable forms
On a regular GDC you can only plot functions with something, but desmos offers way more flexibility here. All of the following can be immediately graphed on desmos:
| form | note |
|---|---|
| Basic functions are obviously fine. | |
| Feel free to omit the in many cases | |
| is supported and quite useful (see below) | |
| doesn't need to be the subject. Equations in the general form work fine too. | |
| Your equations don't need to be functions, either. Circle equations, for instance, will work just fine. |
Points of interest
Desmos automatically calculates the coordinates of certain points when you enter an equation into the system. These are
- -intercept
- -intercept(s)
- local minimums and maximums
- points of intersection between two graphs
Try clicking on the graphs below to find all the points of intersection, the intercepts, and the minimum and maximum of the curve.
Plotting Inequalities
To plot inequalities, simply enter a “less than”, “greater than”, “less than or equal”, or “greater than or equal” into the input field. Desmos will shade the area on the -plane that corresponds to the inequality.
ℹ️ To type a less than or equal or greater than or equal symbol, you simply type < or > followed by =, and desmos will automatically convert it into ≤ or ≥ . See keyboard shortcuts for more detail.
Try it yourself!
Try it yourself 👇
Plotting points
Ordered pairs
An ordered pair is a pair of numbers that are used to locate a point on a coordinate plane. The first number in the ordered pair is the x-coordinate, and the second number is the y-coordinate.
In desmos, you can plot ordered pairs by simply typing them into the input field in either brackets.
Try it yourself 👇
Pairs entered on the same line will be plotted in the same color, while points plotted on different lines will generally be plotted in different colors.
Tables
We can also plot points using a table. To add a table, click the plus icon in the top left of the desmos app. Then click the table icon.
The table accepts ordered pairs in the form of . You can also add columns to the table by clicking the empty space on the right side of the table header. This allows you to plot multiple points at once, where every point shares the same -coordinate.
Try it yourself 👇
notation
notation provides us with a handy way of thinking of functions in the plane. If you aren't already comfortable with , you should take the time to learn it. We'll assume for now that you have a basic idea of how it works.
One neat feature of desmos is that it allows us to plot graphs using notation. While this may not be useful in many cases, occasionally it's super helpful. For example, if we've plotted a quadratic equation like so:
and now we want to calculate what is equal to when is , you have to enter the whole equation into your calculator again, increasing the number of steps and chances of screwing up.
On the other hand, if you'd entered the equation like so:
You could simply enter into the next input field, and desmos will automatically calculate it for you:
Try it yourself!
Try it yourself 👇
ℹ️ To turn equations on and off, click the wavy circle beside the input field. Try it yourself below:
Trigonometry
Trig Functions
You’ll find all the trig functions you need by toggling the keyboard and then clicking the functions button at the top right hand corner of the keyboard.
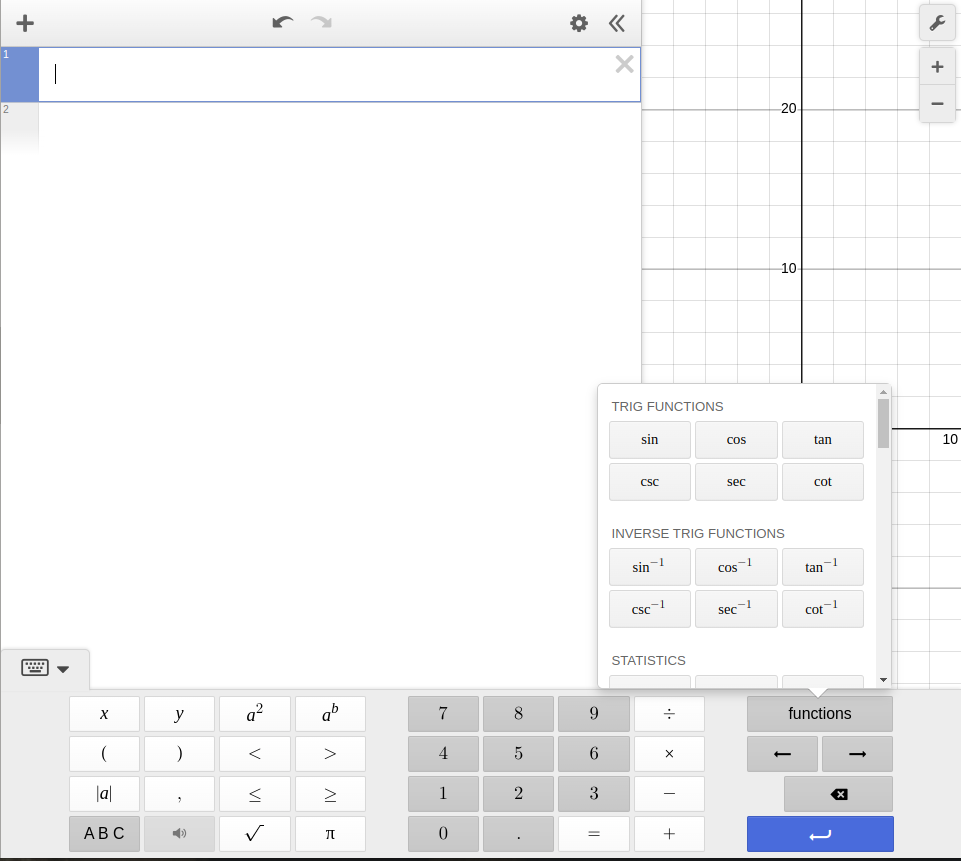
You can also simply type the functions into the input field. So if you want to calculate , you can simply type sin60 into the input field and desmos will automatically calculate the value.
Try it yourself!
Try it yourself 👇
See keyboard shortcuts for more detail.
Radians vs Degrees
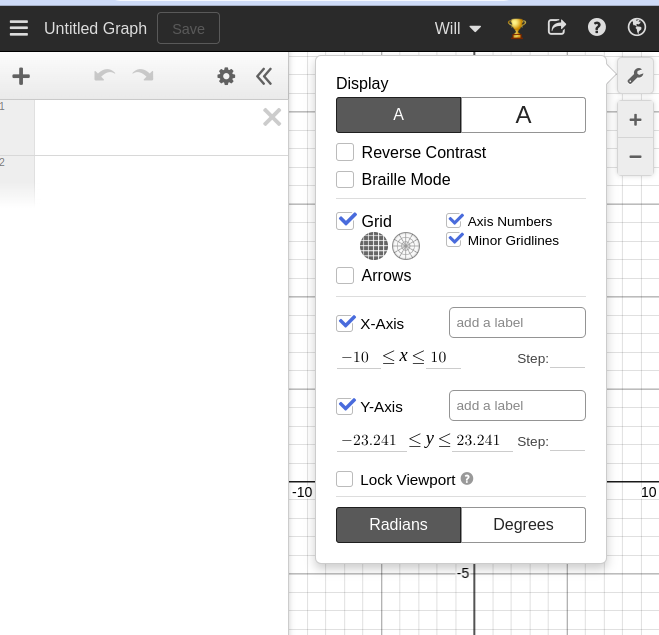
At times you may be asked to provide an answer in either degrees or radians. By default, desmos uses radians. To switch to degrees (or back to radians), simply click the wrench in the top right corner to toggle the menu. At the bottom of the menu, click either “radians” or “degrees” depending on your needs.
Statistics
Desmos also allows you to calculate the mean, median, standard deviation, first quartile, third quartile, and many more 1-variable statistics.
On the SAT, you’ll only need to know how to calculate the mean, median, and standard deviation.
And even when you do need to calculate these statistics, you’ll rarely need to use desmos to do so.
In any case, here’s how you can calculate the mean, median, and deviation on desmos:
Try it yourself 👇
If you really want to get fancy, you can even create lists to avoid re-entering data.
Try it yourself 👇
Transformations
Try it yourself 👇
Using constants
Desmos allows us to graph equations with unknown constants. This means we can write a function like , and desmos will offer us the option to create a slider so we can graph the function with different values of .
Try changing the value of by pulling the slider or inputing a value manually:
Try it yourself 👇
You can also click the play button next to the constant and desmos will create an animation by automatically changing the value of the constant, like so:
Try it yourself 👇
If the range of possible values for the constant is too small, you can change the range manually by clicking on the slider.
Keyboard shortcuts
You should avoid opening the app's built-in keyboard whenever possible. While a few rare functions and symbols may require you to fish through the app's built-in keyboard, there are keyboard shortcuts that will greatly improve your typing speed and help you maintain focus. Here's a list of important combinations to remember:
| keys | result | comment |
|---|---|---|
a*b | With constants, feel free to omit the multiplication symbol | |
a/b | Your cursor winds up on the denominator of the fraction | |
/a | Your cursor winds up on the numerator of the fraction and the denominator is still blank | |
a/b/c | Create a nested fraction by simply repeating the pattern | |
a^b | None | |
sqrty | Works with brackets as well | |
cbrtz | Works with brackets as well | |
pi | Desmos treats as a number so this is super useful | |
theta | Probably not that useful but who knows? | |
x1 | This can be useful when you want Desmos to treat as a constant rather than a variable | |
x_a | When creating subscripts with letters you'll need to explicitly add the underscore | |
a>b | A simple "greater than" symbol | |
a>b | A simple "less than" symbol | |
a>=b | Adding the symbol creates a "greater than or equal" symbol | |
a<=b | Adding the symbol creates a "greater than or equal" symbol | |
sinx | Works with brackets as well | |
cosx | None | |
tanx | None | |
sin^-1(a) | Hardly ever used | |
cos^-1(a) | Hardly ever used | |
tan^-1(a) | Hardly ever used | |
arcsin(a) | Hardly ever used | |
arccos(a) | Hardly ever used | |
arctan(a) | Hardly ever used |
In the next section, we'll look at how to apply these features to SAT questions.